The Data Organizer is the tree view that graphically display how the measurements are divided into Test Setup and Channels as explained in details in the Manage Measurements Task:
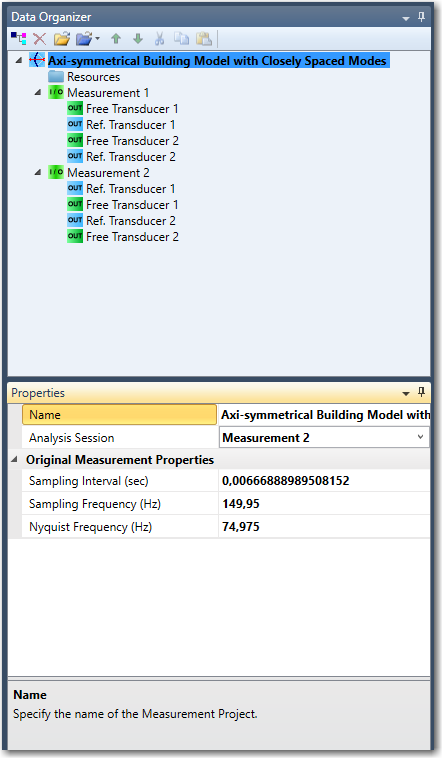
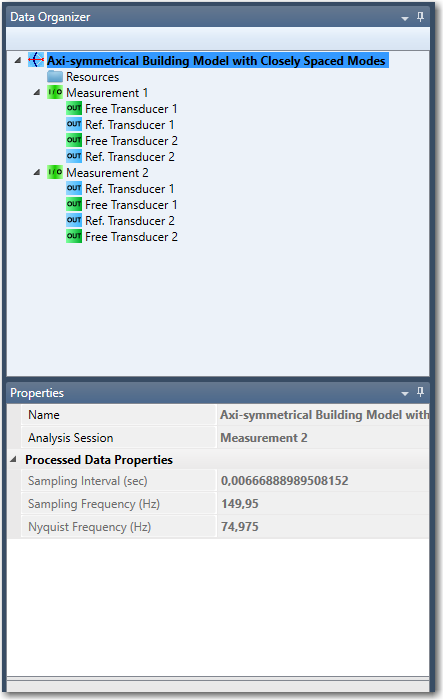
Many of the properties of the Data Organizer items can be edited while you are working with the Setup tasks. As an example above the sampling interval of all the connected Test Setups can be changed in the Setup tasks whereas these properties change and become read-only in the Analysis task, see below:
When you click on an item in the Data Organizer you also select this item in various windows that can present information about it, such as the Geometry window and the Processed Data window.
Properties for the Measurement Project Item
The top level item in the Data Organizer is called the Measurement Project Item and it has the properties as shown above. In the Setup tasks the Name can be changed as well as the Sampling Interval of all the Test Setups of the project. If some Test Setup has been uploaded with the Sampling Interval not correctly set then it is necessary to change this otherwise it will not be possible to connect the Test Setup. To be sure that all Test Setups are having the same Sampling Interval it is convenient to specify this at the Measurement Project level.
Instead of specifying the Sampling Interval it is possible to set the Sampling Frequency or the Nyquist Frequency. In any case the two other option are updated accordingly.
Properties for the Test Setup Item
The Test Setup item is the explained the Manage Measurements Task and it properties are shown below.
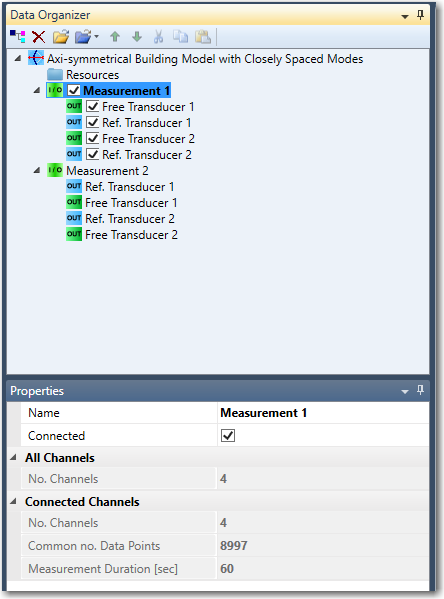
The Name is the label and can be any text.
When Connected is checked the Test Setup is connected and included in the analysis. It can only be connected if there the sampling interval is the same as the other Test Setups, Where the first Test Setup serve as the reference. In case of multiple Test Setups there must be the similar reference channels in all Test Setups. If one differs it will be disconnected.
All Channels is a read-only value of the total number of channels in the Test Setup.
Connected Channels is a read-only section informing how many channels that are connected and how many data points (samples) that these channels have in common. Finally, it is also written what the Common No. Data Points actually corresponds to in seconds. This is provided as the Measurement Duration [Sec].
Properties for the Data Set Item
The Data Set Item is the place holder for repeated recordings of the same Test Setup, see Manage Measurements Task for details. The options are only editable in that specific task.
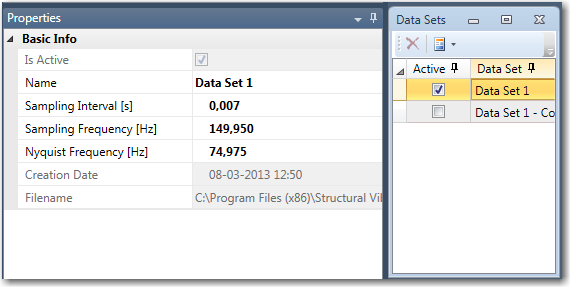
The Name is the label and can be any text.
IsActive is a read-only check mark indicating if this Data Set is the active one or not. Use the Data Sets window to control this.
The Sampling Interval specify the sampling interval of the recording stored in this Data Set. Instead of specifying the Sampling Interval it is possible to set the Sampling Frequency or the Nyquist Frequency. In any case the two other option are updated accordingly.
Creation Date specify the time the Data Set was created.
Filename indicate the source of the recording store in the Data Set.
Properties for the Channel Item
The properties of a specific channel can be viewed when it is selected as below:
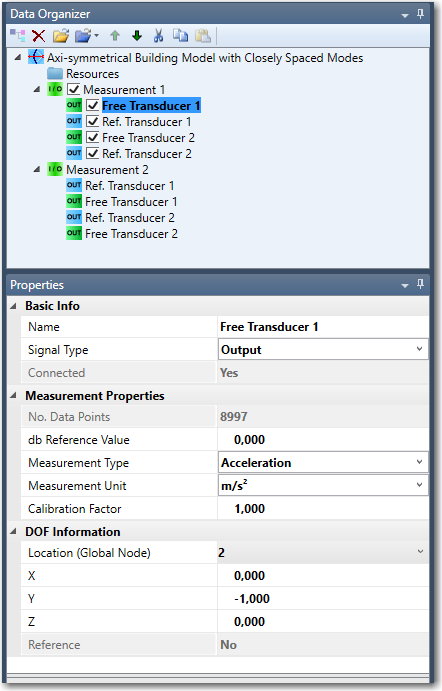
The Name is the label and can be any text.
Signal Type has two options the Input option that should be used for classical modal analysis the Output that should be used for operational modal analysis.
If it is connected to a point on the global Geometry then Connected will indicate this with a Yes. This value is read-only as it is controlled by the DOF Information section.
No. Data Points returns the number of data points explicitly stored in this channel.
The dB Reference value is the reference value that all dB scaled spectral diagrams presenting this channel should be normalized with. The default value is 1.
The Measurement Type display the measurement unit of the data. The measurement type can be changed between Displacement, Velocity and Acceleration. Default is Acceleration.
The Measurement Unit display the measurement unit of the data. The unit can be changed by clicking in the value-field. A drop-down list will be shown. Default is m/s2.
Calibration Factor is the factor that the measurements of this channel should be multiplied with when exported out of the project. The default value is 1.
Location (Global Node) indicates which Global Node number (geometry point) is connected to the selected channel. If the selected channel has been disconnected, and the user wants to connect the channel again, the correct node number (the same as before disconnecting) must be typed in by hand in the value-field. If the channel is disconnected, disconnected will appear in the field.
The X, Y and Z values are the coordinates of the directional vector of this channel relative to the global x,y,z coordinate system.
Reference is a read-only value indicating if this channel is a reference or not. If other Test Setup's have a channel connected in the same node and direction as this channel, then it is automatically assumed to be a reference.
Functions
Once the Setup task is complete and the user goes to the Prepare Data task and do the Signal Processing, the Data Organizer is updated with new items i.e. the Function groups and the Function items, like in the image below.
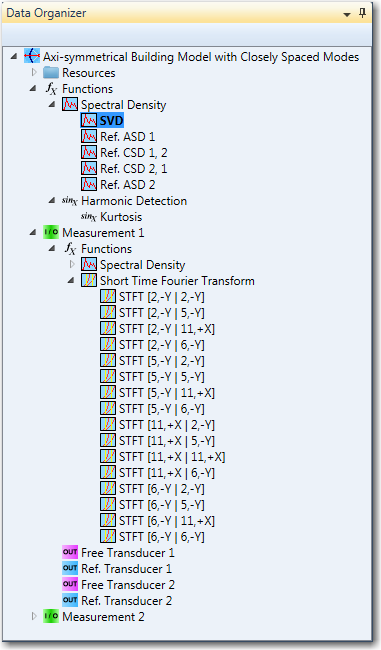
The available functions are grouped into the following categories:
- Spectral Density
- Short Time Fourier Transform
- Harmonic Detection (Kurtosis)
By default, the Spectral Density - SVD function is selected and is the one being displayed in the Processed Data or Modal Estimation Window. As soon as the user switches to another function the corresponding diagram is being displayed in the related windows.
Note: The Harmonic Detection functions are available only if the Harmonic Detection is enabled in the Signal Processing. The Short Time Fourier Transform (STFT) in previous versions of the software is also referred as Spectrogram. For more details on the Functions check the Processed Data Window.
Each of these Functions has Properties which can be configured:
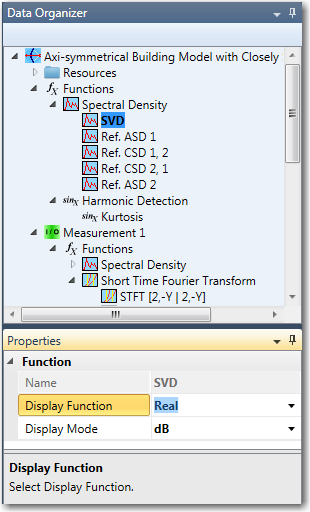
Display Function
Depending on the selected function, Display Function can have the following values:
- Absolute
- Phase
- Real
- Imaginary
Display Mode
This property is actually the scale in which the function is presented on the diagram. Available options are:
- dB
- Linear
See Also